Robert Rundstrum said that creating maps is fundamental to lending order to the world. I geek out over maps, dashboards, and overall visuals of how data can be creatively displayed. So much so that I co-lead the Food Systems Dashboard with our friends at GAIN, which gives a complete view of food systems by bringing together data from multiple sources. The Dashboard allows one to compare food system drivers and components across countries and regions, gain insights into challenges, and identify actions to improve nutrition, health, and environmental outcomes.
Dashboards are maps, and often, they are displayed as maps. Maybe my obsession with maps comes from how much time I spend walking with my better half, stepping across geography step by step. As Rebecca Solnit said,
“A labyrinth is a symbolic journey . . . but it is a map we can really walk on, blurring the difference between map and world.”
I use “maps” loosely as most data displayed, whether a bar graph, histogram, or geographical map, is a record of a diagrammatic representation of how we exist or how we perceive our existence through time. Mere representations of an ever-changing reality of where we have been and where we are going.
Some argue that we are in a heightened state of data map overload, with an insane amount of dashboards displaying all kinds of data. Are we suffering from “death by dashboard?” But I, and I think many others, appreciate dashboards. Just look at the success of Our World in Data, or how everyone, every day, all the time, tuned into the Johns Hopkins COVID Dashboard as the pandemic grew (they stopped collecting data this past March. They knew when “to fold ‘em.”
There are some new food-related maps and dashboards that are pretty cool. Check out The Food Twin tool. This tool visualizes a model designed to predict where food is grown and connecting that food to where it is consumed in the U.S. The data moves, showing the vast network of how food is produced and consumed. Speaking of networks, the Global Food Systems Network map visually represents the relationships among stakeholders involved in food systems-related efforts worldwide. Some other cool maps are out there, including the World Food Map, which displays the most commonly consumed foods in each country.
Let’s thank our farmers for the incredible diversity of foods available around the world. But they are dealing with significant risk. The Agriculture Adaptation Atlas maps climate risks and identifies solutions for farmers. Lastly, the new Clim-Eat dashboard shows a range of food system technologies that show great promise in improving food security while mitigating or adapting to climate change.
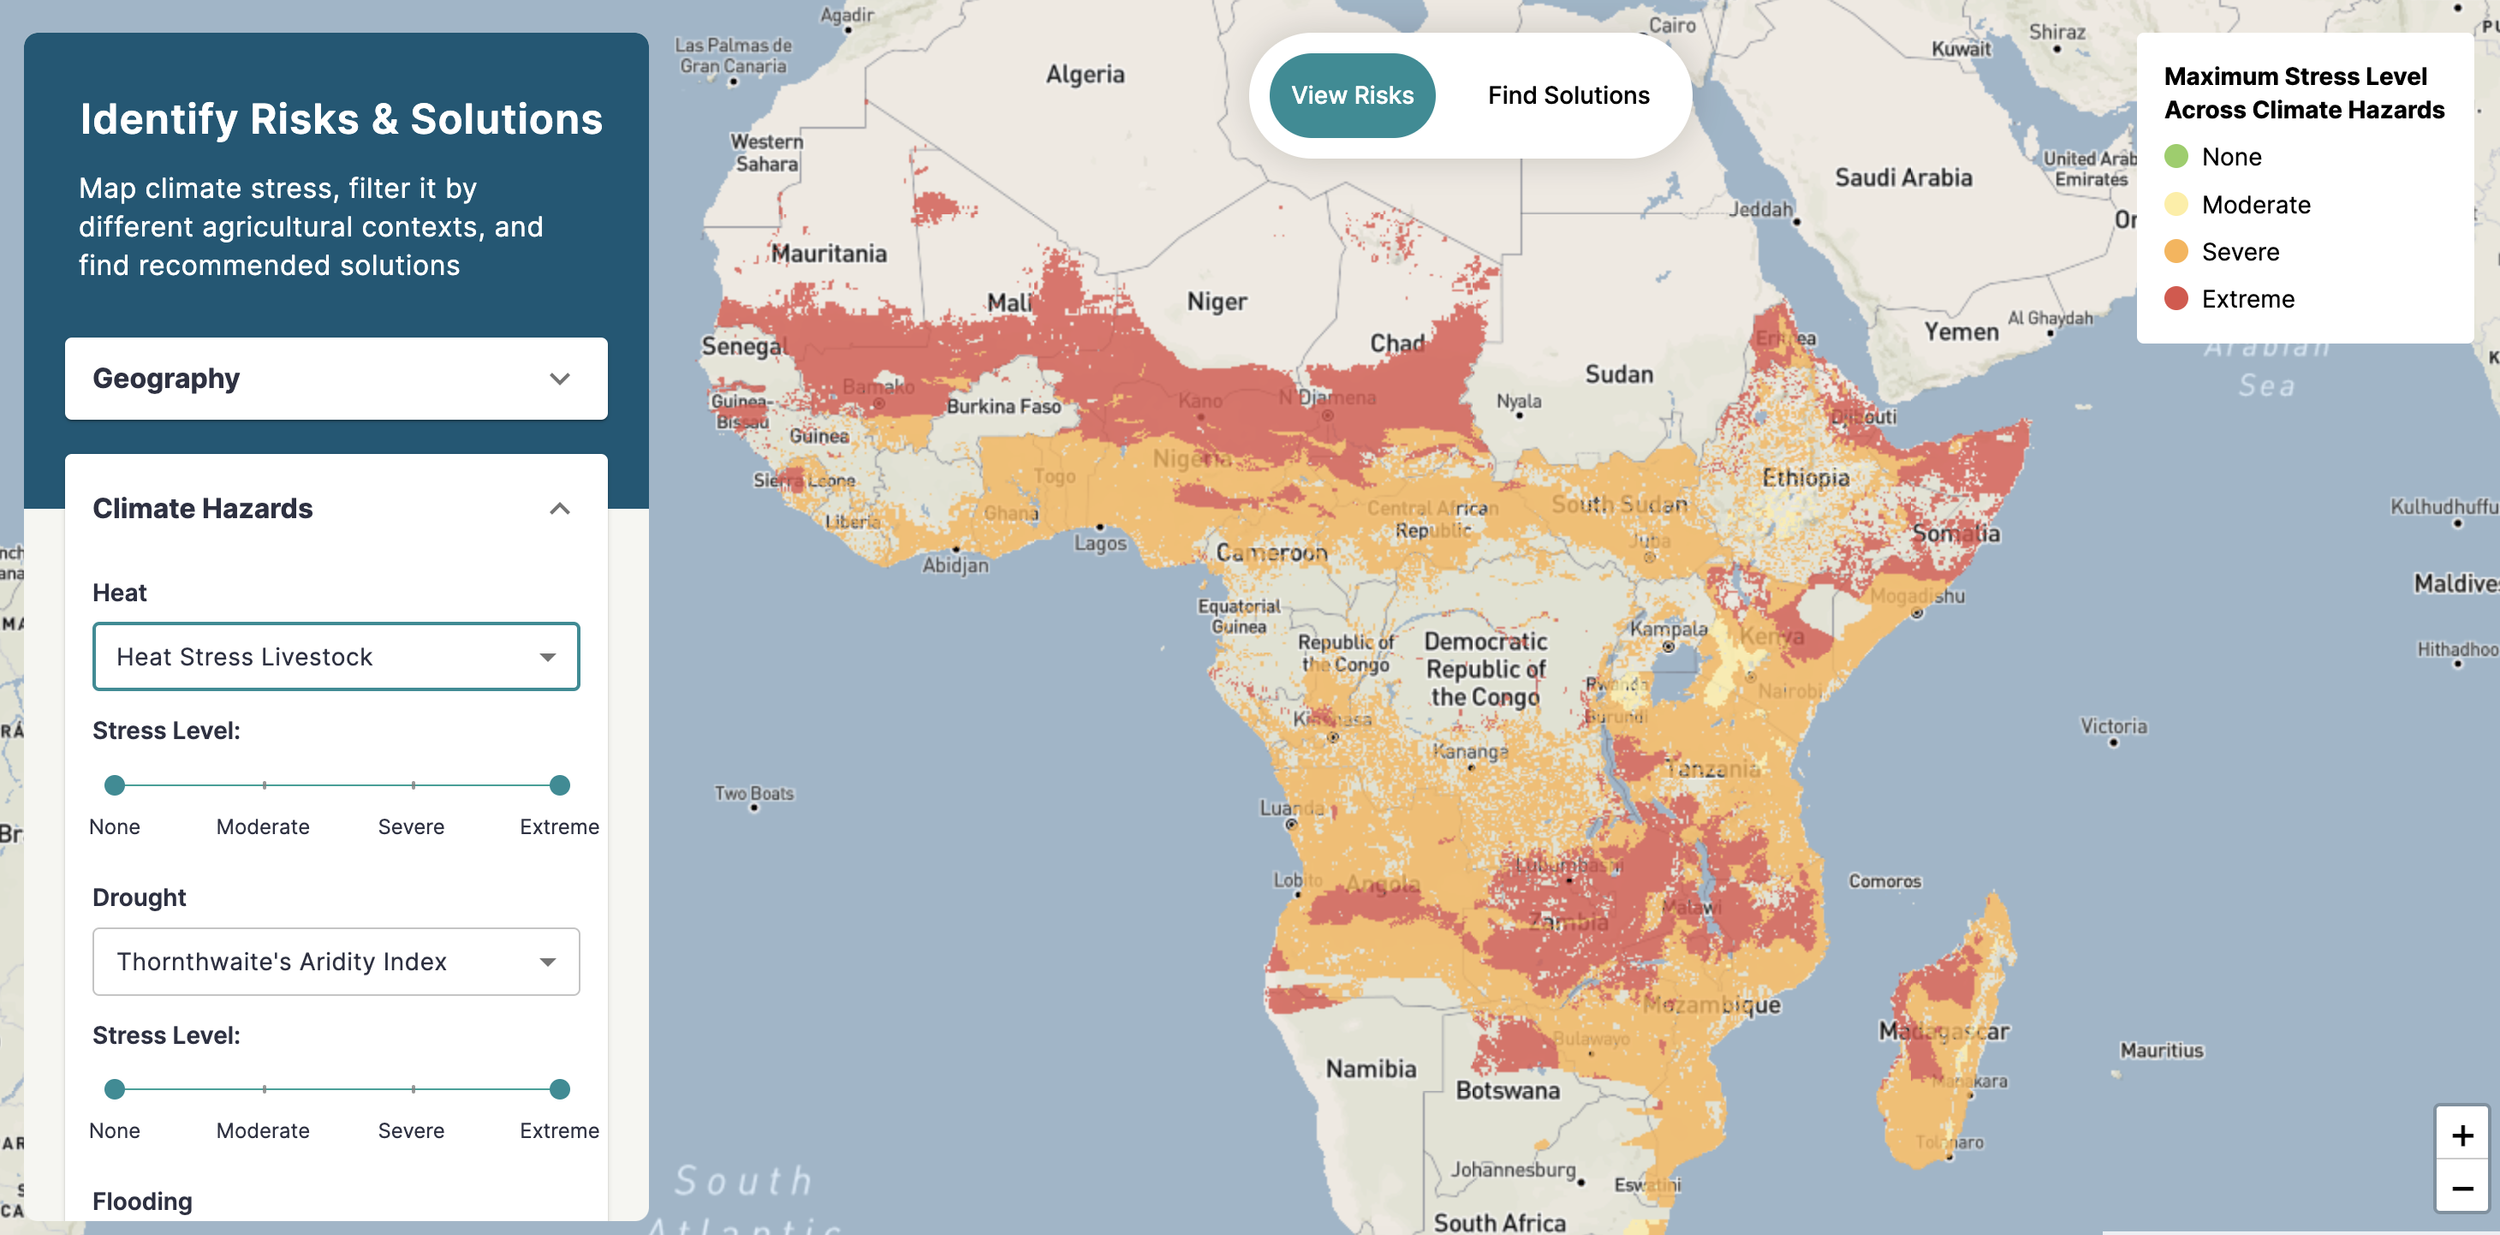
From the Agriculture Adapation Atlas: Showing heat stress of livestock in sub-Saharan Africa
Beyond food, so many exciting projects are trying to display data to ensure it is accessible to everyone. Vivid Maps displays all kinds of data. For example, here is a map of what the boogeyman looks like worldwide. What the hell is the Jersey Devil? Seems apropos. Or, how cats migrated to Europe…Some useful information, some…not so much.
But this map, Native Digital Land, is fantastic. It is a searchable map of Native territories, languages, and treaties. You can click on the map across the Americas and other areas to see which Indigenous tribes lived there and their histories. Just looking at the United States is incredible and devastating. This is a collaborative endeavor and will consistently change as more Indigenous peoples interact and provide historical information to the map.

Native Digital Land, showing the Native American territories of the United States
And if you really want to geek out, Oculi Mundi has put out a collection of antique maps that are stunning. Just check out this “Anatomy of the Ceasars map.” They just don’t make ‘em like this anymore. The site is just so beautifully done, and all open access—such a beautiful thing.
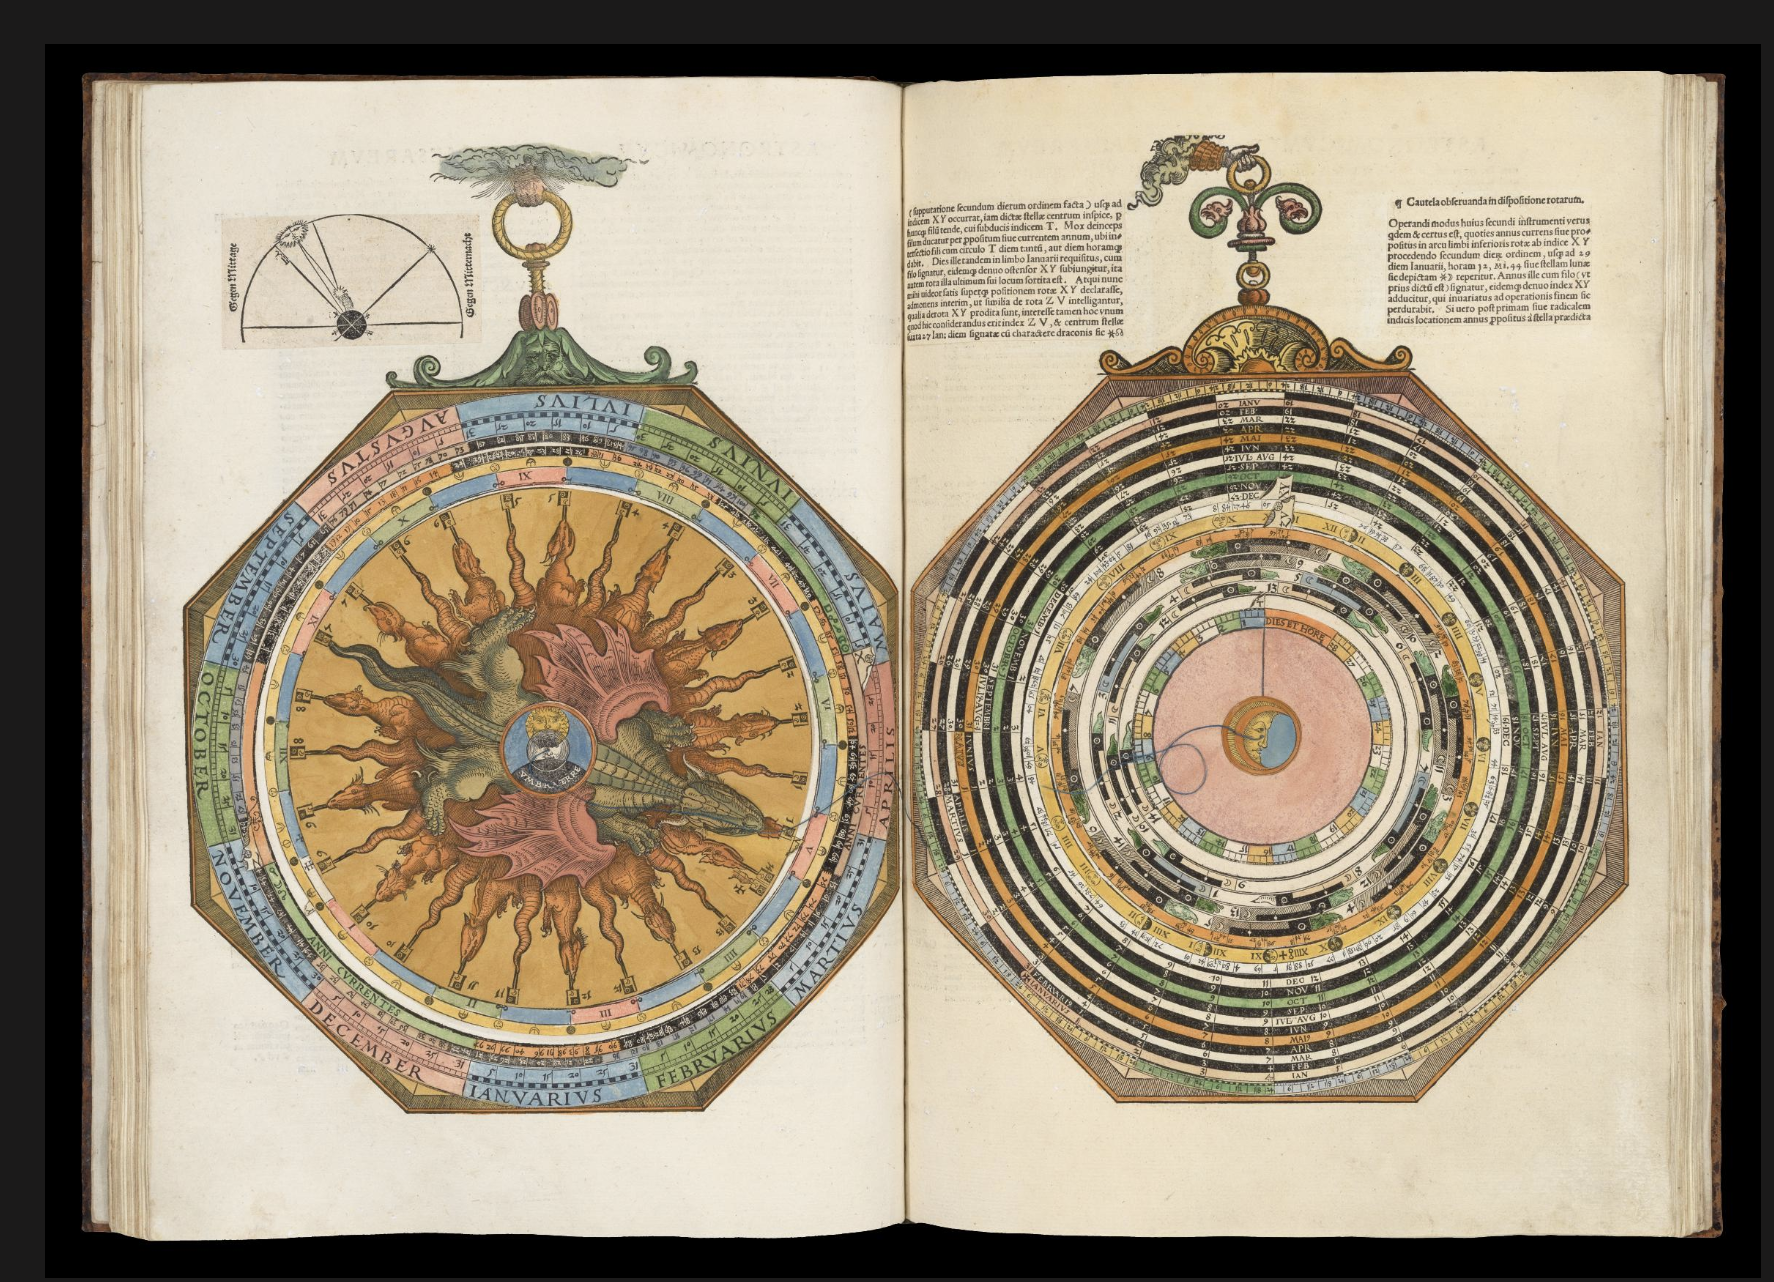
From Oculi Mundi